Wine Industry Metrics
by Jim GordonWine Industry Metrics
February 2014Domestic Wines Grow 7% in Off-Premise Sales in 2013
Off-premise sales of domestic wine finished 2013 with a 7% growth rate and $7.3 billion for the year, according to IRI. Sales volume in domestic table wine grew 3% to reach 98 million cases, while domestic sparkling wine sales volume grew 7% to 3 million cases.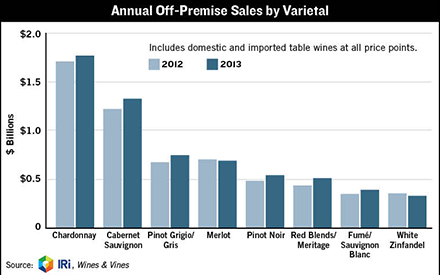 READ MORE »
Wine Industry Metrics
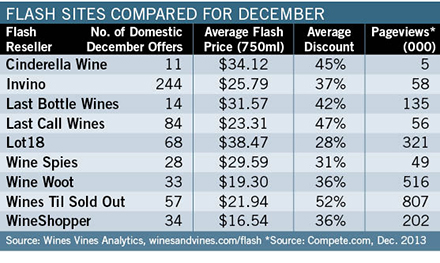
February 2014Offers Spike in December
 READ MORE »
Wine Industry Metrics
February 2014Wine Sales Grow 7%; Winery Jobs Up 27% in 2013
The three key Wine Industry Metrics covered by Wines & Vines for the complete year 2013 were all positive. Domestic wine sales enjoyed 7% gains in both the off-premise and direct-to-consumer channels. Off-premise results totaled $7.3 billion in stores monitored by IRI. The same growth rate brought $1.58 billion sales in DtC shipments. More dramatic was the 27% growth seen in the Winery Job Index, reflecting a growing and confident U.S. wine industry..jpg) Sales of domestic wines grew 6% in December compared to December 2012, according ?to IRI. December was by far the biggest month of 2013, with $742 million in sales.READ MORE »
Sales of domestic wines grew 6% in December compared to December 2012, according ?to IRI. December was by far the biggest month of 2013, with $742 million in sales.READ MORE »
Wine Industry Metrics
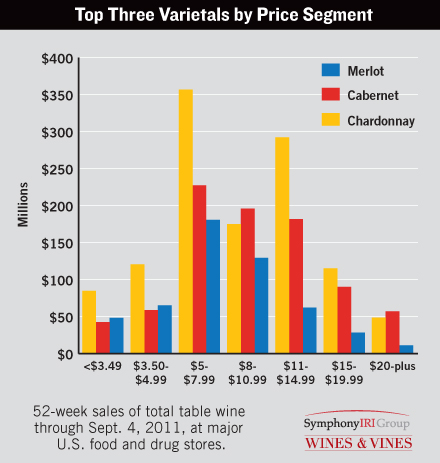
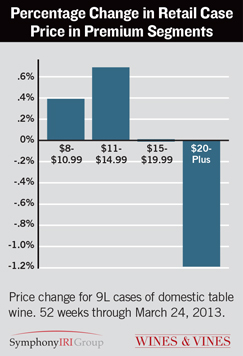
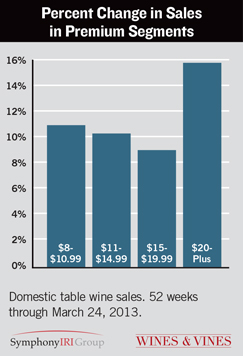
May 2013Fast-Growing Sales Accompany Lower Prices
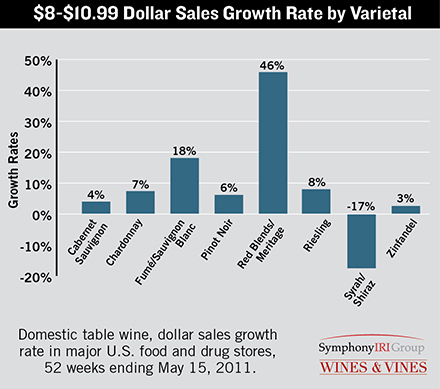
The premium wine category with the biggest price reduction enjoyed the biggest percentage gain in sales during the past 52 weeks, according to March data from the Symphony IRI Group (SIG). Domestic table wines priced at $20 and higher came down in price by $3.62 per case, yet they rang up sales of $238 million (a 15% increase).READ MORE »

Wine Industry Metrics
February 2013Our Economic Indicators All Positive as 2012 Ends
READ MORE »Wine Industry Metrics
February 2013Wineries Continue to Enter Flash Market
Nearly four times as many wineries had wines offered through flash sites in December 2012 than in January 2011. The 382 unique U.S. wineries with offers in December 2012 represented the highest monthly total since WinesVinesDATA first started tracking flash offers.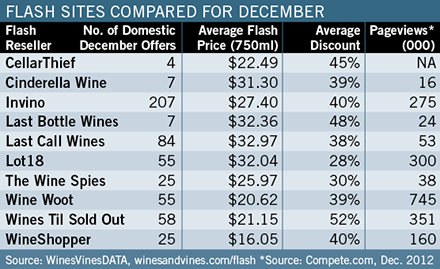 READ MORE »
Wine Industry Metrics
February 2013Off-Premise Sales Up 6% in 2012
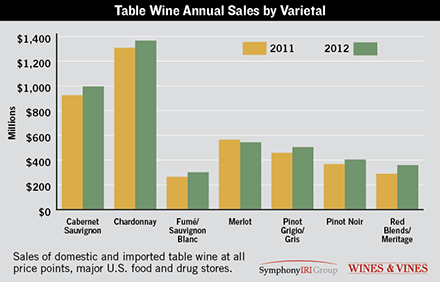 Retail sales continued to increase in December, finishing a year of 6% growth for domestic table wines and passing the $5 billion mark. Revenues in December 2012 (always the biggest month of the year) beat the same month in 2011 by 4% and reached 6.3 million cases, according to the Symphony IRI Group (SIG).
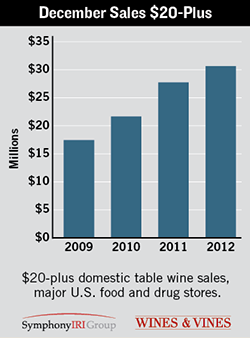 READ MORE »
Wine Industry Metrics
January 2013Invino Emerges as Top Flash Site by Offers
Invino has grabbed the lead from Lot18 and Wines Till Sold Out (WTSO) in the flash market. From January to November of 2011, Lot18 and WTSO accounted for the most domestic wine offers, with 676 and 678 respectively, while Invino posted 522 offers. For the same period this year, Invino offered 1,057 wines, WTSO stayed constant at 682, but Lot18’s total offers had slipped to 414. The overall total of flash offers from January to November 2012 was 4,813, which is an increase of 42% over 2011. In other flash site news, Lot18 announced in early December that its chief marketing officer, Jay Sung, had been promoted to chief executive officer, and Olly Garland, former CEO of Direct Wines, had left an advisory role to join the company’s board of directors.READ MORE »Wine Industry Metrics
January 2013The Future of Flash
Blogger-turned-retailer-turned-flash site-operator Walid Romaya admits he had concerns about the flash wine sales market before launching his new website.READ MORE »Wine Industry Metrics
November 2012Wine Woot Driven by Fans and Critics
Sonoma, Calif.—The online retailer and Amazon subsidiary Wine Woot doesn’t lead the flash sales market in terms of offers; what sets it apart from other retailers is its distinct and loyal community of fans.READ MORE »Wine Industry Metrics
November 2012Robust Market for Red Blends, Syrah Stagnant
The number of total offers for the past nine months (3,895) was 50% larger than in 2011. Red blends had the highest rate of growth in offers. Flash sites offered twice as many red blends during the same months in 2012 as in 2011. Number of offers rose from 236 to 479, and the average flash price for red blends rose by more than 20%. Cabernet Sauvignon still accounts for nearly 30% of all flash offers, but the rate of growth in the number of red blend offers was far higher than for any other variety. Flash prices for Merlot rose by 10%, while Cabernet and Pinot Noir’s average flash prices grew by 8%. Syrah had the weakest growth in number of offers; its average flash price fell by 4%, and its average discount stayed the highest at 40%—all of which indicate Syrah is a tough sell even for flash sites.READ MORE »Wine Industry Metrics
November 2012Winery Job Index Drops While DtC Shipments Soar
A substantial drop in the Winery Job Index as harvest began was the only negative movement in our Wine Industry Metrics for September. Hiring activity dipped for all three job types measured by Winejobs.com, but hospitality jobs dropped the furthest at 25%. Winemaking jobs eased off by 5%, and sales and marketing jobs were down 14%. Direct-to-consumer shipments enjoyed a month of swiftly increasing sales as the most popular time of year for wineries to ship arrived. Sales took a seasonal bump, and they also improved upon September 2011 by 36%. The news for U.S. wine sales in stores was good, too, growing 7% from a year ago.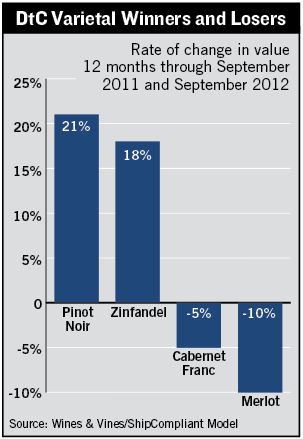 Pinot Noir and Zinfandel were the hottest varietals in DtC shipments over the past 12 months in terms of rate of change in sales. Cabernet Sauvignon remained the most popular varietal in the channel. It grew, too, but only at 5% from a bigger base. Its family members from Bordeaux, Cabernet Franc and Merlot, were the two fastest sinking varietals. Note that winners and losers vary by sales channel. Syrah/Shiraz fell the fastest at retail and was also a tough sell among flash sales. Red blends in DtC grew by 14%, reflecting a similar trend at stores, where they were the hottest thing around, selling 26% more this year.
READ MORE »Wine Industry Metrics
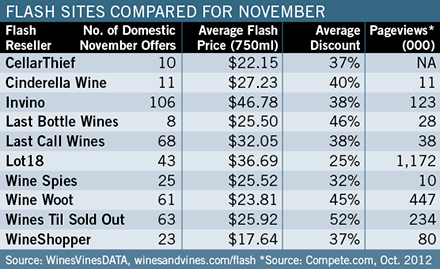
October 2012Cabernet Sauvignon Leads in Flash Offers
None of the other four top wines offered by flash sites came close to matching or surpassing Cabernet Sauvignon by number of offers in the past 12 months. Of the 5,159 total offers in the past year, the top four varietals and blends accounted for 63%, and Cabernet had a 30% share. At the high point for offers in December, there were 167 for Cabernet Sauvignon, 84 for Pinot Noir, 69 for red blends and 56 for Chardonnay. Special release events dramatically increased the average price for Cabernet Sauvignon and red blends this summer, although average flash prices stayed relatively stable. Chardonnay, for example, maintained an average of $20. In just the past month, the nine major flash sites offered 380 wines from 254 unique wineries with an average discount of 34% and an average flash price of $27.59.READ MORE »Wine Industry Metrics
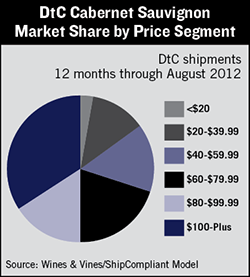
October 2012August Data Reflects Strong Wine Economy
Wine Industry Metrics for August show a strong domestic wine economy reflected in retail sales and direct-to-consumer sales (up 8% and 6% respectively over August 2011), and winery hiring activity was up 19% as the 2012 crush began. Off-premise sales have stayed above $350 million per month all year. DtC shipments suffered their usual summer slowdown due to fear of heat damage in transit but still grew over the previous August. Winery job postings were way up, too. Only hospitality jobs slipped in August.Consumers ordering Cabernet Sauvignon direct from wineries spent the biggest share of dollars in the most expensive price category during the 12 months through August 2012. Cabernet Sauvignon selling for $100 per bottle and higher accounted for 34% of the varietal’s total sales with $139 million. The second-largest category was $60-$79.99 with $82 million in sales. Cabernet is also the most popular of all varietals sold DtC. The slices of the pie differ markedly from those at food and drug stores.
READ MORE »Wine Industry Metrics
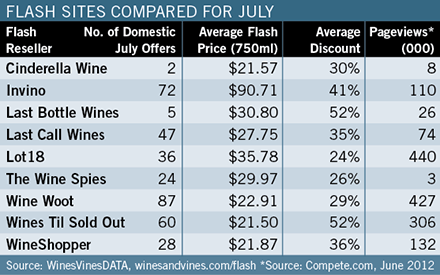
September 2012Winery Jobs Lead Metrics As July Shows Positive Signs
The Winery Job Index grew 63% in July over the same month in 2011, reflecting dramatic growth in winery hiring activity as the harvest season approached. Winemaking jobs in particular grew 139%, while sales, marketing and hospitality jobs increased at slower rates. Several years of regularly increasing domestic wine sales--and the emptying of bulk-wine reserves--have spurred production and increased personnel needs. Off-premise sales stayed steady at 7% growth, and direct-to-consumer shipments grew, though at a lower rate than in the past 12 months.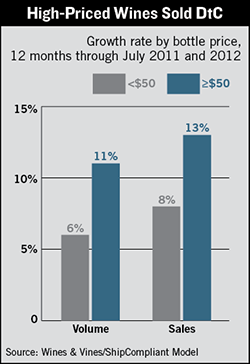 Bottles priced at and above $50 showed faster growth in volume and total sales during the 12 months ending July 31 than those priced under $50. Higher priced wines grew by 11% in volume and 13% in sales, and lower priced wines grew at 6% in volume and 8% in sales. While higher priced wines' volume represented less than a quarter of the under-$50 volume, they generated nearly the same amount in dollars. Revenues were $658 million for wines $50 and up and $697 million for wines priced less than $50 per bottle.READ MORE »
Wine Industry Metrics
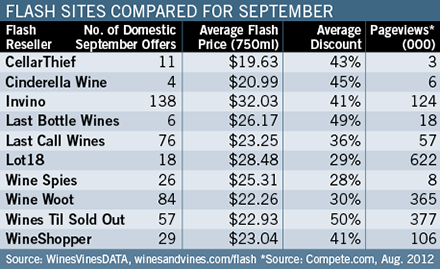
September 2012Blue-Chip Cabernets Drive Up Flash Prices
Several flash sites offered high-priced Napa Valley wines in July. Bottles of Harlan Estate, Joseph Phelps Vineyard, Shafer Vineyards and Opus One pushed the average retail price for flash offers higher. The most expensive wine was a 1997 Harlan Estate Cabernet Sauvignon with a retail price of $1,700 and flash price of $930. However, of the 5,226 offers tracked by WinesVinesDATA in the past 12 months, only 1,551 (or 30%) were for wines with a winery retail price of $50 or more. Invino had the most offers for these types of wines with 508 (or 40%) of its total 1,266 offers. The average discount for wine with an average winery retail of $50 or more was 41%, and the average discount of the other 3,675 offers was 38%.READ MORE »Wine Industry Metrics
August 2012New Metrics Up as Jobs Grow
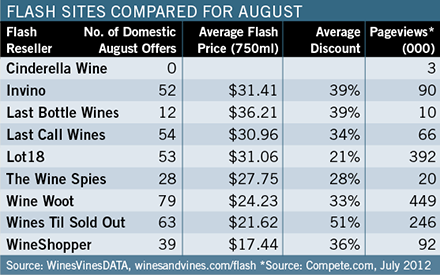
Steady growth continued in Wines & Vines' three wine industry metrics during June. The Winery Job Index improved the most compared to June 2011, even though hiring activity reached a peak in May. Retail sales of domestic table wines appeared very stable, with identical 7% growth by dollars for the four-week, year-to-date and 52-week timeframes. Growth by volume was a slower 3% year-to-date, as prices grew 20 cents per bottle. In DtC shipments, average bottle prices vary significantly by season, and June's $31.26 was the lowest this year.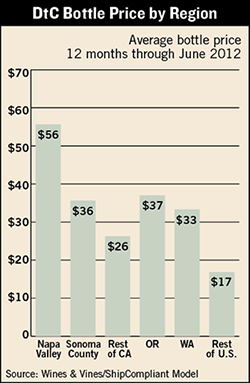 It's no surprise that average bottle prices for DtC shipments from Napa Valley wineries were the highest among all regions, but it's interesting to see that Oregon wines nosed out Sonoma County for second priciest. These findings compare roughly to those on the opposite page for flash-discounted wines. There, the flash prices for wines grown in the Russian River and Sonoma County AVAs virtually tied those from Oregon's most prominent AVA, Willamette Valley.READ MORE »
Wine Industry Metrics
August 2012Carneros AVA Discounted the Most
The most popular varietal wines from California’s top wine regions received some of the highest discounts in the past year.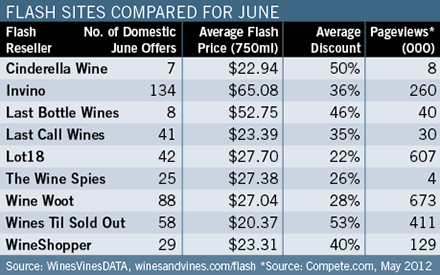 READ MORE »
Wine Industry Metrics
July 2012More U.S. Wineries Enter Flash Market
At the start of 2012, the flash market saw a 41% increase in the number of wineries selling their wares online. READ MORE »
Wine Industry Metrics
July 2012Job Postings See Strong Gains
Wine industry job postings continued to grow at a strong rate, posting a 49% increase over the previous year as wineries looked to hire seasonal positions in hospitality as well as boost winemaking staff in anticipation of the coming harvest.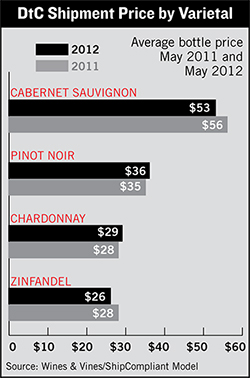 Top varietal wines stayed flat or dropped in average price: Cabernet Sauvignon and Zinfandel, two of the top varietals in DtC shipments, continued to drop in average price. Cabernet’s average price of $53.27 is 5% lower than last year, and Zinfandel’s average is down 9% to $25. 87. The other two top varietals, Chardonnay and Pinot Noir, posted a 2% increase. Across all varietals and wine types, the overall average bottle price for DtC shipments is relatively flat at $33.15 compared to May 2011 at $32.57. Many top varietals are seeing downward price pressure, while blends and sparkling wines are showing bottle price gains./div>READ MORE »
Wine Industry Metrics
June 2012Three Sites Offer Majority of Wines
Invino, Lot 18 and Wines Til Sold Out submitted the most wine in the flash world during the past 12 months, accounting for 63% of all domestic wine offers. Invino posted the most flash offers with 1,114, followed by WTSO’s 791 and Lot 18’s 767. Invino alone accounted for 26% of the 4,232 offers by the top nine flash sites monitored by WinesVinesDATA. Of the top three by total offers, WTSO had the highest average discount through the same period with 51%. Invino’s average discount was 45%, and Lot 18’s was 35%.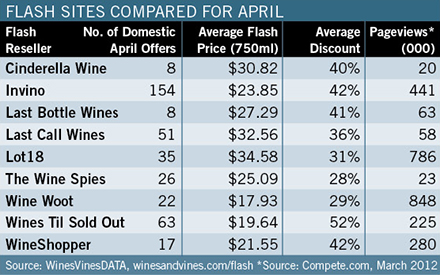 READ MORE »
Wine Industry Metrics
June 2012Wine Industry Metrics Slightly Mixed for April
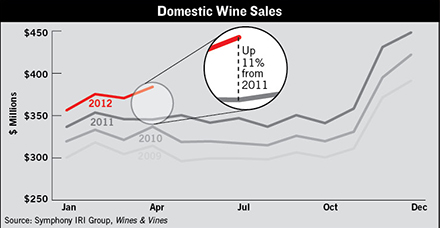 Domestic table wine sales increased 11% in the four weeks ending April 15 vs. the same period a year ago. The hot growth was fueled by Easter holiday sales including sparkling wine.
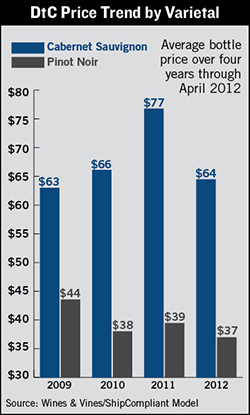 Prices for the two most popular varietals in DtC shipments from U.S. wineries are down so far this year. Pinot Noir and Cabernet Sauvignon both gave up their gains over the last two years, while still selling at prices much higher than their averages at retail stores. Cabernet stayed $27 higher per 750ml than Pinot Noir this year. Average bottle prices for all varietals decreased by 7% to $40.23 in the 12 months through April. The highest average bottle price of $47.95 was reached in March 2010.
Off-premise sales and winery hiring activity grew by 11% and 12% respectively in April, but slightly lower revenues for direct-to-consumer shipments muddled the overall economic picture. The numbers for off-premise sales reflected unusually large growth, and they were exaggerated by the different dates when Easter was celebrated this year and in 2011. DtC shipments continued to grow in volume but dipped in value, indicating that average bottle prices were down.
READ MORE »Wine Industry Metrics
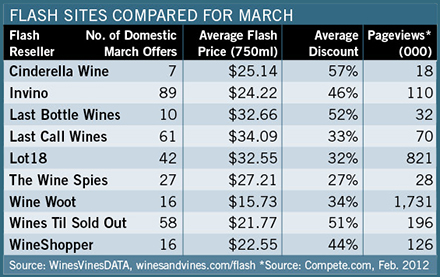
May 2012Store Sales and DtC Sales Up; Winery Hiring Way Up
Both off-premise sales and direct-to-consumer shipments grew in solid single digits in March, while winery job activity outpaced March 2011 by 18%. The monthly job index was at its highest point in at least four years, but ironically the rate at which it increased in March was actually lower than the 12-month rate of 25%. The number of jobs posted in the hospitality and retail sector nearly doubled from the February count. Our latest data for DtC shipments by winery size show a steady inverse correlation between bottle price and winery size. In other words, the smaller the winery, the higher the price per bottle. The 12-month numbers ending March 2012 are displayed here alongside the March 2011 data, and indicate that the smallest and the largest wineries saw decreases in bottle price, while the middle tiers saw increases. The average bottle price for wineries making 1,000-4,999 cases grew by $6—from $38 to $44, or 16%.
READ MORE »Wine Industry Metrics
May 2012High Number of Flash Offers for '07 Vintage
During the past 12 months, the highest number of flash offers came from 2007 vintage wines, according to WinesVinesDATA. Flash retailers posted more than 1,000 offers for 2007 wines, and the '08 and '09 vintages saw high offer counts as well. A look at average discount by vintage shows that the highest price cuts (more than 50%) were for wines 1999 and older, which averaged just above 50%.READ MORE »Wine Industry Metrics
April 2012Cabernet is Top Varietal
Napa and Sonoma counties led the flash world during the past six months, accounting for more than 70% of all domestic flash offers. Cabernet Sauvignon took the largest share of offers by varietal or type. Of the 2,525 total flash offers from the past six months, 2,069 (or 82%) were from California. Napa was the leader with nearly 1,000 offers, but Sonoma was a close second with 855. By type, the top wine was Cabernet Sauvignon at 741 offers, followed by Pinot Noir at 424 and red blends at 301. There were 75 offers for Sauvignon Blanc, the second-highest for a white varietal. The explosive growth of Moscato does not appear to have reached the flash world, as there were only three offers for that wine.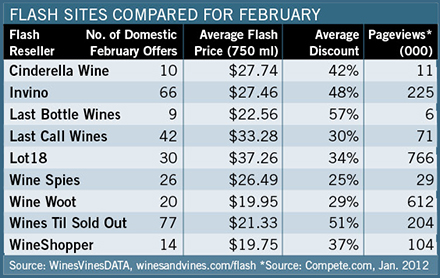 READ MORE »
Wine Industry Metrics
April 2012February Brings Healthy Growth
Direct-to-consumer shipments and winery hiring activity grew especially fast in February compared to the same month in 2011. The volume of DtC shipments increased by 8%, while value rose 12%, indicating higher prices per bottle. Hospitality staff jobs led a 43% gain in winery hiring activity; winemaking and sales and marketing job postings also increased. Off-premise sales continued to show steady growth at major U.S. food and drug stores.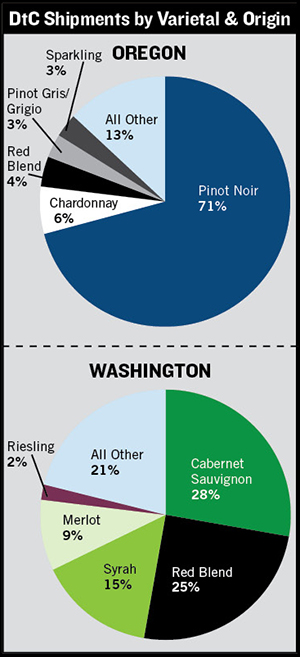 Varietals shipped DtC by Oregon and Washington wineries varied drastically. Based on value data for 12 months through February. Source: Wines & Vines/ShipCompliant Shipment ModelREAD MORE »
Wine Industry Metrics
March 2012Winery Job Index up 53% As Vintners Hear Good News
Lots of good news reached the wine industry in January, as speakers at the Unified Wine & Grape Symposium reported low bulk wine inventories and high demand, confirmed that the U.S. is still the No. 1 wine market in the world and hailed increased exports. It may not be a coincidence that winery hiring activity as measured by Winejobs.com started the year much higher than the past three. Retail sales in major food and drug stores and direct-to-consumer shipments both kept up their recent growth streaks, too, growing 6% and 3%, respectively.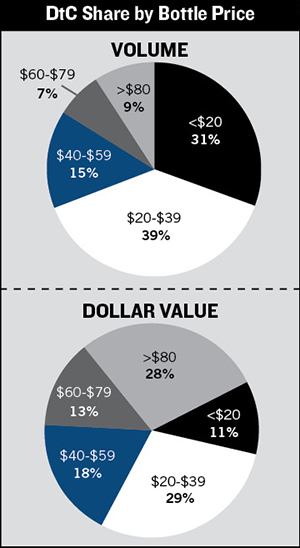 Wines priced from $20-$39 per bottle took the biggest share in both dollars and volume among five price tiers of wines sold via DtC shipments. The most expensive tier grabbed nearly as much dollar share, however. Data for 12 months through January. Source: Wines & Vines/ ShipCompliant ModelREAD MORE »
Wine Industry Metrics
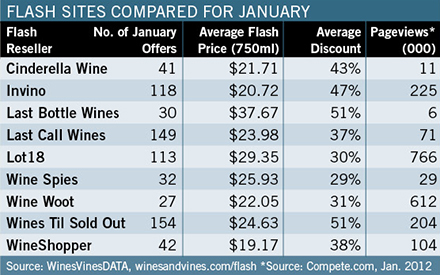
February 2012Flash Sites Ranked by Average Discount
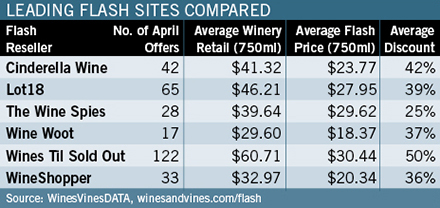
WinesVinesDATA reviewed the flash data from August through January and found that Last Bottle Wines offered the largest average discount of 48%, or $31.58. The site chose higher priced wines for its flash sales during the same period, meaning it offered the biggest deals on the most expensive wines. Despite the large discounts, Last Bottle Wines, which sells one wine until it’s sold out, still sold wine at the most expensive average flash price of $34.43. WineShopper posted the lowest flash price of $21.29 and an average discount of 39%. The cheapest wine by average retail price, $32.37, could be found on Wine Woot, which offered an average discount of 31%. In total, the nine major flash sites made 706 offers from 572 unique wineries in January. Wines Til Sold Out had the most offers with 154, followed by Last Call Wines’ 149 and Invino with 118.READ MORE »Wine Industry Metrics
February 20122011 Ends With Growth In Sales and Winery Hiring
The year 2011 ended on a high note for all three of the Wine Industry Data Center’s measures of economic health. Domestic wine sales in major food and drug stores were up 8% in December over the previous year, and domestic direct-to-consumer wine sales beat December 2010 figures by 7%. Both of these data sets spent all of 2011 on a higher level than 2010. The Winery Job Index for 2011 only dipped below 2010 in the month of February and finished in December with a 6% increase over December 2010.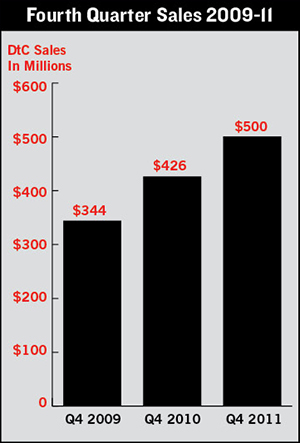 Wineries shipping directly to consumers had a great fourth quarter in 2011, as sales topped $500 million. This total surpassed 2010’s fourth-quarter sales by 17% and 2009’s mark by 45%. October and November were the year’s two biggest selling months, at $197 million and $200 million; so even though December is relatively slow, the fourth quarter is DtC’s strongest of the year. The DtC data come from a model developed by Wines & Vines and ShipCompliant.Wineries shipping directly to consumers had a great fourth quarter in 2011, as sales topped $500 million. This total surpassed 2010’s fourth-quarter sales by 17% and 2009’s mark by 45%. October and November were the year’s two biggest selling months, at $197 million and $200 million; so even though December is relatively slow, the fourth quarter is DtC’s strongest of the year. The DtC data come from a model developed by Wines & Vines and ShipCompliant.READ MORE »
Wine Industry Metrics
February 2012Seasonal Uptick for Some Online Retailers
As 2011 came to a close, some of the flash sites tracked by Wines & Vines exhibited an increase in offers to clear out inventory and take advantage of the traditional surge in wine buying that accompanies the holidays. Invino, in particular, posted more than three times as many offers in December than it did in July as it conducted an inventory clearance sale. Lot 18 steadily increased its number of offers from October through the end of December for a high of 183, giving it the second-highest number of offers in December. Invino and Lot 18 posted multiple offers per day in December. Wines Til Sold Out, however, had the highest total number of offers in the past six months with 898. The average bottle price from the flash sites with the most offers in December was $28.89.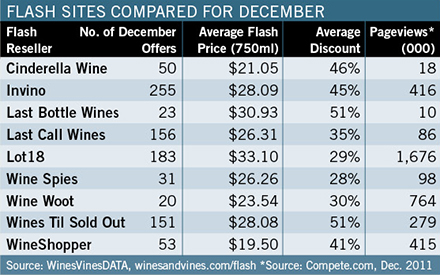 To download a full PDF version of The Flash Report for December, click here.
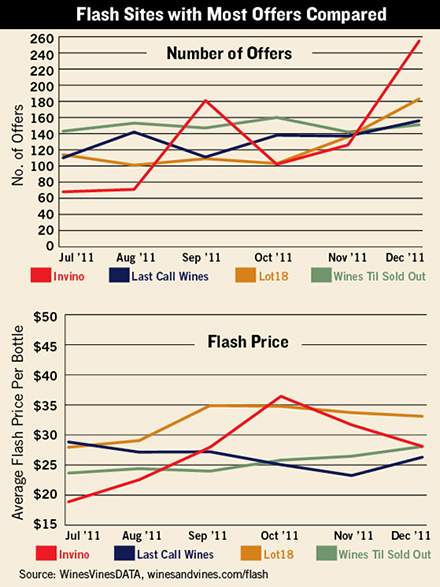 READ MORE »
Wine Industry Metrics
January 2012Great Growth in November
The winery economy was heading for a great year's end, according to the November data that Wines & Vines analyzed from three sources. Domestic wine sales at retail, direct-to-consumer wine shipments and winery job activity all finished November far above the levels of November 2010 and 2009. Since December is typically the biggest month for retail sales, the year will probably end with even higher numbers than shown on the Domestic Wine Sales graph here. DtC shipments are not particularly a holiday phenomenon, however, and are expected to decrease as usual in December.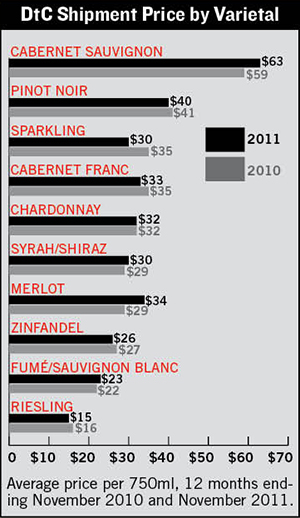 Merlot enjoyed the biggest increase in average price per bottle from November 2010 to November 2011 among the 10 most popular varietals for direct-to-consumer shipments from U.S. wineries. Merlot increased $5 and passed Cabernet Franc, while Cabernet Sauvignon--already at the top of the scale--went up $4 per bottle to $63. Sparkling wine lost the most ground, from $35 down to $30.READ MORE »
Wine Industry Metrics
January 2012Flash Wine Sales Offers More Than Double
READ MORE »Wine Industry Metrics
December 2011Red Blends Popular; Lot18 Gets $30 Million
So far this year red blends lead the pack in number of offers by the nine top flash sites monitored by WinesVinesDATA. Cabernet Sauvignon leads in bottle price. In the graphs below, we show the varietals/types by both measures of popularity. Domestic and imported wines were both included, so red blends include everything from red Bordeaux to Cotes du Rhone to super Tuscans to California Meritage. In other flash site news, fast-growing Lot18 announced $30 million in Series C funding led by Accel Partners and that Accel’s Sameer Gandhi will join Lot18’s board of directors. The company reported that in one year it had sold more than 500,000 bottles of wine and is selling more than $1 million per month.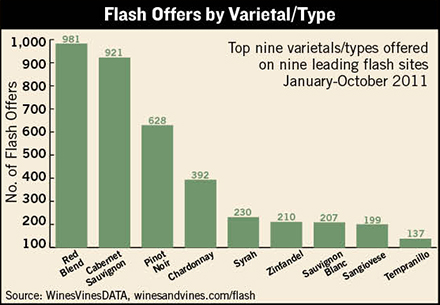 READ MORE »
Wine Industry Metrics
December 2011DtC Shipments Grow 31% Over October 2010
The spike in DtC shipments stands out as the most dramatic news in the Wine Industry Data Center this month. A 31% gain in the value of October DtC shipments over last October is impressive, but since last year’s results were already up by the same 31 points over October 2009, the newest numbers are even more positive. Domestic wine sales at retail stores continued to grow at a very healthy pace of 8% during the most recent four-week period, according to Symphony IRI. Winery job activity grew 10% over last year, too, despite the normal seasonal decline.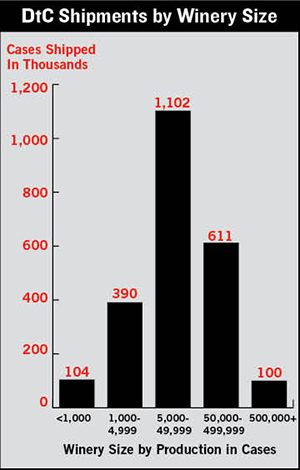 The Wine Industry Data Center first brought you this graph in February, but now we’ve updated it with the latest numbers, year to date. It shows again that medium-sized wineries direct-ship more cases than their smaller competitors. Note that the middle tier also significantly surpasses the largest wineries in direct shipments. The biggest brands focus almost exclusively on three-tier sales. These figures, expressed in thousands, reflect total shipments of 9-liter case equivalents.READ MORE »
Wine Industry Metrics
November 2011Domestic Wine Sales Steadily Up
San Rafael, Calif.—Domestic wine sales at major U.S. food and drug retailers remained steadily up for the most recent period measured by the Symphony IRI Group. Four-week dollar sales ending Sept. 4 hit $351 million and grew 7% over the same period last year. The year-to-date growth rate was also 7%. Volume sales of domestic table wine grew a bit more slowly, at 5%, as prices edged up 8 cents per 750ml.READ MORE »Wine Industry Metrics
November 2011September Shows Great Sales and Hiring Activity
Our three indicators of wine industry economic health collectively hit a growth rate in September that hadn't been seen since at least October 2010. The growth in wine sales at retail and in DtC shipments was clearly driven by consumer interest. DtC shipments for September were way up in volume as well as price per bottle. The big jump in winery hiring activity probably relates more to the first real balance of supply and demand for grapes and bulk wine since 2005.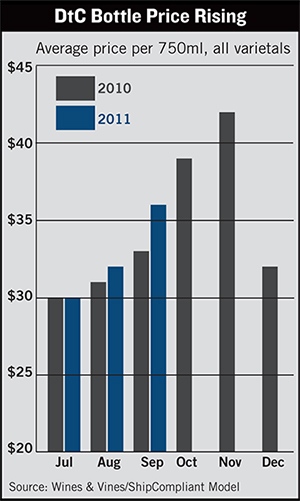 Any business would be happy to see sales and prices go up at the same time. That's what happened with DtC shipments of domestic wines in September. The big 33% jump in DtC dollar sales in September versus a year earlier reflected a 21% increase in volume sales accompanied by a 10% rise in average bottle price. If the sales trend continues through December, it will have been a great year.
READ MORE »Wine Industry Metrics
November 2011Wine Woot Leads in Domestic Wine Emphasis
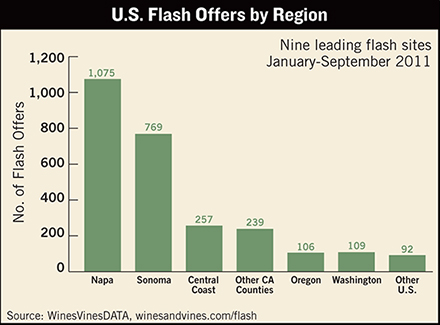
This month we examined the WinesVinesDATA numbers for wine flash site activity in terms of winery location. In the graph below at left, North American wineries and vineyards can learn which sites favored their products in 2011. Wine Woot was the most domestic-oriented of the nine leading sites we monitor, and it had the second-highest traffic according to Compete.com. The Wine Spies, Lot18 and Invino were not far behind in concentration on domestic wines. Wines Til Sold Out was the most active site from in terms of offers, and it usually provides the deepest discounts. The graph below at right shows the most popular winery regions for flash offers. Napa's lead was not necessarily anything to brag about, since flash sites take advantage of wineries with slow sales and excess inventory.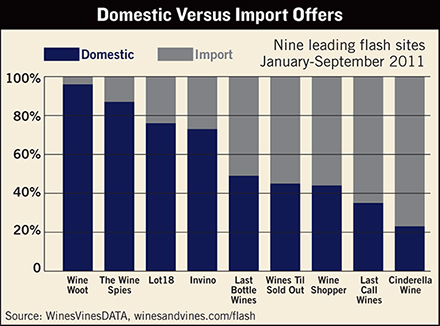
To download a full PDF version of The Flash Report for November, click here.
READ MORE »Wine Industry Metrics
October 2011Looking at Invino, Last Bottle and Last Call Sites
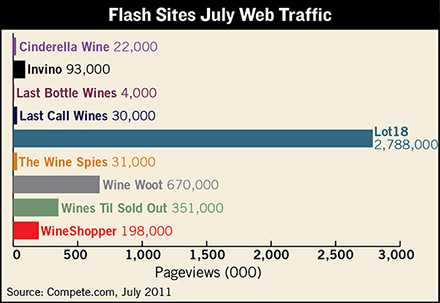
The Flash Report has been focusing on six leading wine flash sites since it first appeared in the February 2011 issue of Wines & Vines. But our research team, WinesVinesDATA, has been tracking several more flash or near-flash wine sales sites every day for most of this period, and this month we have added three more companies to the group of leading sites. Last Bottle Wines, Last Call Wines and Invino are all active sales sites with many offers per month. Last Call offered 142 wines in August, nearly as many as the ever-active Wines Til Sold Out. Last Bottle had the highest average offer price of $33 in August, which may be good for its winery customers. Invino enjoyed the highest web traffic of the new additions with 93,000 pageviews measured in July by Compete.com.
READ MORE »Wine Industry Metrics
October 2011U.S. Wine Sales Up 7% Year-to-Date
Symphony IRI Group’s latest data about domestic wine sales showed growth in dollars at 7% for the year to date compared to a year ago, and the same 7% rate for the four weeks ending Aug. 7. The numbers are based on check stand scan data from major U.S. food and drug stores.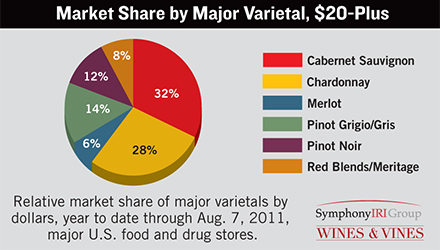 READ MORE »
Wine Industry Metrics
October 2011August Was a Hot Month for the Wine Economy
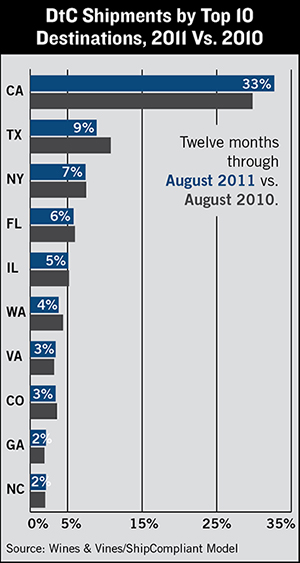 Our data show that Californians ordered an even greater percentage of the DtC shipments of U.S. wine in the past 12 months than they did in the same period through August 2010. Second-ranked Texas saw a slight decrease in their share of DtC shipments. New York, Florida and Illinois kept their Nos. 3, 4 and 5 positions, while Virginia and Colorado swapped spots Nos. 6 and 7.
August may be the hottest month in terms of temperature, but in the wine economy it’s usually one of the coolest. Still, Wines & Vines' metrics of sales and winery-hiring activity showed very positive August numbers. Direct-to-consumer shipment in particular showed a big increase over 2010 in dollars during a month when many shipments are delayed until cooler weather returns to prevent damage to wine enroute.
READ MORE »Wine Industry Metrics
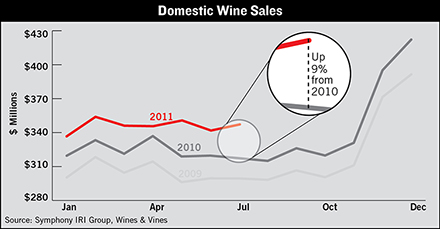
September 2011Domestic Wine Sales Up 9%
Domestic wine sales in July grew nearly as fast as the economy of China, reaching $347 million, according to check stand scan data from major U.S. food and drug stores. The four-week growth rate for wine was 9.1% higher than the same period last year, nearly matching China’s 9.5% growth in GDP for the second quarter.READ MORE »Wine Industry Metrics
September 2011Sizing Up the Leaders in Wine Flash Sales
The graphs in this month’s Flash Report give a good, quick overview of offerings by wine flash site leaders from the past six months.READ MORE »Wine Industry Metrics
September 2011Wine's Economic Indicators Rose Before Stocks Crashed
 Symphony IRI reported that domestic wine sales at major food and drug stores grew 9% in July over the same period last year.
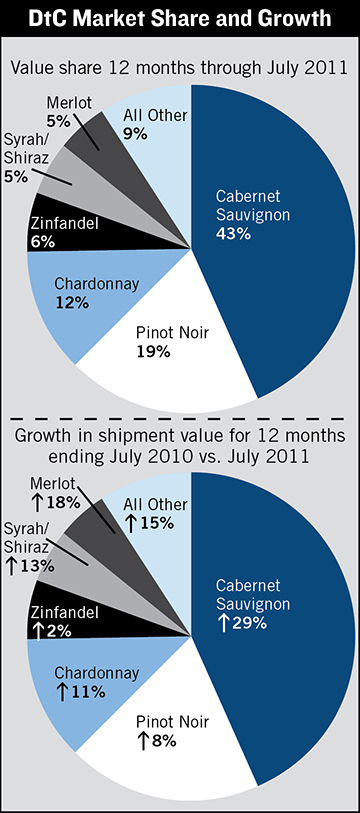 Cabernet Sauvignon continued to dominate varietal market share for domestic wines shipped direct to consumer (top) while all major varietals grew in sales value (below).
July data—gathered just before the stock market plunged during the second week of August—showed a strong wine economy in terms of sales and winery hiring activity. Retail domestic wine sales for the most recent four weeks grew at a rapid 9% pace over the same period last year, while direct-to-consumer shipments and the winejobs.com Index also grew over last year.
READ MORE »Wine Industry Metrics
August 2011Gallo's Growing Barefoot Brand Is No. 1
San Rafael, Calif.—E. & J. Gallo Winery’s fast-growing Barefoot brand remained No. 1 in retail sales for the 52 weeks ending June 13, with $255 million in sales, according to SymphonyIRI Group, a Chicago-based market research firm. With Carlo Rossi ranking seventh in sales and Gallo Family vineyards ninth, the Gallo company owns three of the top 10 brands. Two other Gallo products, Livingston Cellars and Peter Vella box wines, also made the top 20..jpg) READ MORE »
READ MORE »Wine Industry Metrics
August 2011Wine Market Data Show Reasons to Be Optimistic
Key indicators in our monthly data all pointed up in June. Domestic wine sales stayed ahead of last year by a healthy 7%, direct-to-consumer shipments also beat last year’s performance and Winejobs.com reported an unusually high 23% increase in winery hiring activity. No one has proclaimed an outright boom in the wine economy, partly because restaurant sales have been recovering more slowly than other channels, but wineries and marketers have good reasons to be optimistic.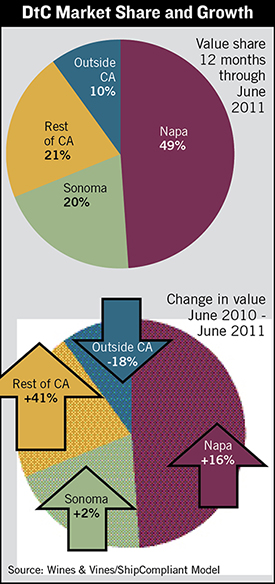 The pie charts show four wine regions' DtC shipment share of market (top) and growth rates (bottom). Note the growth in California shipments from beyond Napa and Sonoma.READ MORE »
Wine Industry Metrics
August 2011Wines Til Sold Out Leads in Offers, Discounts
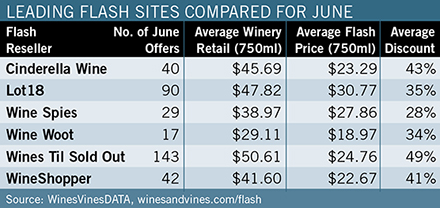 Wines Til Sold Out made significantly more flash sale offers than the other five leading flash sites in June and provided the largest average discount of 49% off winery retail, according to WinesVinesDATA. WTSO offers also averaged the highest winery retail, at more than $50. The bar graphs below show how dominant U.S. wines are over individual import countries for these flash sites, but the percentage of U.S. wine offers vs. total import offers was a more balanced 57% vs. 43%. Napa easily leads all U.S. regions in number of offers.READ MORE »
Wine Industry Metrics
July 2011No Gloom in Sales Or Job Data Through May
It was difficult to ignore the good news in off-premise sales, direct-to-consumer sales and winery hiring activity as May ended. The late-arriving Easter holiday gets some of the credit for 10% higher off-premise sales reported by Symphony IRI. Whether the holiday might also have boosted DtC sales remained unclear, but it was undeniable that a 17% gain over May 2010 last year was welcome news. A high level of winery job activity is expected in late spring, and the Winery Job Index bore that out with its best May in at least three years.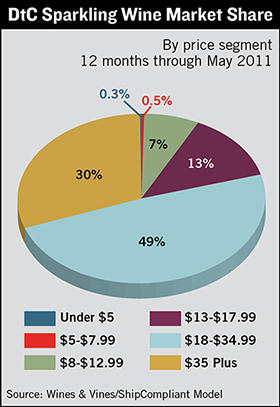 WinesVinesDATA examined the market share of DtC shipments of domestic sparkling wine by price category to see how they compare with a graph based on off-premise sales as measured by SIRI (facing page.) Not surprisingly, people who went to the trouble of ordering direct paid more for their bubbly. The differences were so dramatic that it's difficult to find a family resemblance between the two pie charts.
READ MORE »Wine Industry Metrics
July 2011Retail Wine Sales Spike in May
San Rafael, Calif.—The four-week period ending May 15 was a hot one for off-premise wine sales. Dollar sales of domestic table wines grew 10% over the same four-week period last year, according to Symphony IRI Group, a Chicago-based market research firm. The unusually high spike in sales was partly due to Easter falling in the four-week period this year, while it came earlier in 2010.READ MORE »Wine Industry Metrics
July 2011Six Months in, What Are Trends in Flash Sales?
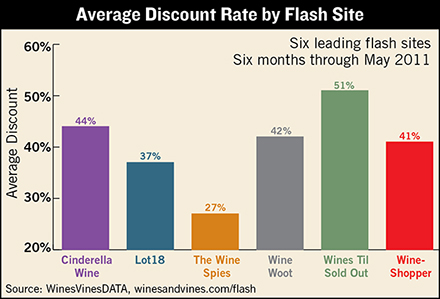 WinesVinesDATA in May recorded 685 offers by the wine flash sales sites that we have formally tracked each month since December 2010. The graphs below examine the leading sites’ average offer prices and average discounts. Offer prices have varied widely within sites but do show trends when compared to other sites, while the average discounts easily set the sites apart. In addition to the six flash sites listed here as the leaders, we now also track several others that may be considered wine flash sites. Watch for more details about those in future reports.READ MORE »
Wine Industry Metrics
June 2011Wine Industry Data Center
April marked seven out of eight months for positive change in all three wine industry economic indicators posted on this page. The lukewarm 2% growth in off-premise sales for the most recent four weeks was backed by a 52-week growth rate of 6%. DtC shipments beat the performance a year ago by the widest margin yet this year. The Winery Job Index beat last April by 10%, representing expanding job opportunities.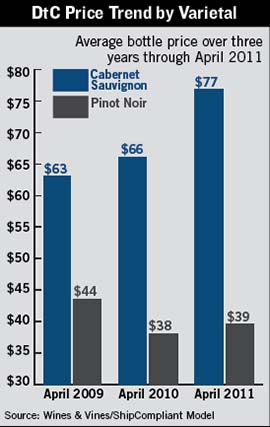 With 25 months of direct-to-consumer shipments data now collected by the Wines & Vines/ShipCompliant Shipment Model, monthly comparisons over three years are possible. The data show that average bottle prices of Cabernet Sauvignon have recovered well since April 2009, while Pinot Noir struggles with an average bottle price $5 below 2009 levels. For Cabernet Sauvignon, April 2011 sales were projected at 46,000 cases with a value of $43 million. For Pinot Noir, the numbers were 55,000 cases and $26 million. The model weighs millions of DtC transactions against exhaustive winery size numbers in WinesVinesDATA.READ MORE »
Wine Industry Metrics
June 2011No Easter, No Problem for Wine Sales
Domestic table wine sales at major retailers continued to grow over last year’s pace in the four weeks ending April 17, according to data from the Symphony IRI Group (SIRI). The four-week growth rate slowed to just 2% for domestic wine—possibly because Easter did not fall during the period this year as it did last year—but the 52-week growth in dollar sales was 6%.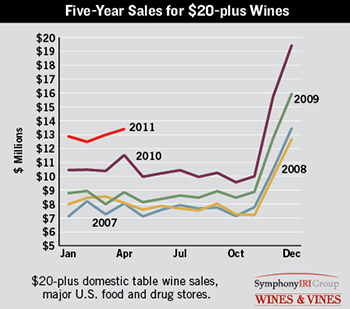 READ MORE »
Wine Industry Metrics
June 2011Flash Site Lot 18 Raises $10 Million to Expand
Lot 18, the New York City-based wine flash site, announced in May that it had raised $10 million in series B funding from investors including NEA Ventures and FirstMark Capital. The graphs below, using WinesVinesDATA, show that Lot 18 has dramatically increased the number of offers it makes per month and leads the other five leading flash sites in average price per bottle at $30. Businessinsider.com quoted Lot 18 co-founder Kevin Fortuna as saying that Lot 18 sales were well past $1 million per month in April. Lot 18 began operations in November 2010.READ MORE »CURRENT COLUMN ARTICLES »