The Leading Source for Wine Industry Data

Wine Analytics Report
A monthly digital publication.
The latest wine industry metrics, market analysis and trends shaping the wine industry.
Ensure your company's success by making informed business decisions based on market conditions and emerging trends.
Industry Databases
Exclusive access to proprietary industry data.
Identify potential sales prospects and new markets.
Create and save searches for highly tailored results.
Buyer’s Guide
Easily locate products and services.
Identify vendors and products across 190 winery categories and 365 subcategories.
Refine search with subcategories and product detail.
Includes over 2000 wine industry vendor profiles outlining their product lineup with contact links.
Directory
Current and comprehensive guide of wine and grape industry professionals in North America.
Identify prospective clients.
Available in print.


WINE INDUSTRY METRICS
| Total U.S. Wine Sales | |||||
| Month | 12 Months | ||||
| March 2024 | $9,773 mil | 5% |
$106,192 mil | 4% |
|
| March 2023 | $9,289 mil | $102,565 mil | |||
| Month | 12 Months | ||||
| March 2024 | $902 mil | -3% |
$12,752 mil | -5% |
|
| March 2023 | $934 mil | $13,385 mil | |||
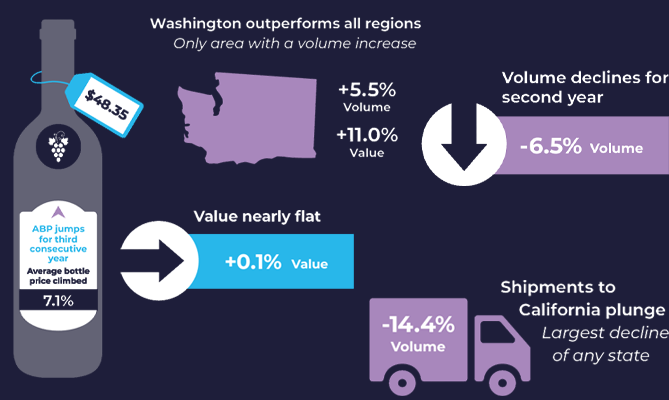
| Direct-to-Consumer Shipments | |||||
| Month | 12 Months | ||||
| March 2024 | $457 mil | -3% |
$4,082 mil | -1% |
|
| March 2023 | $472 mil | $4,121 mil | |||
| Winery Job Index | |||||
| Month | 12 Months | ||||
| March 2024 | 515 | -30% |
494 | -27% |
|
| March 2023 | 738 | 677 | |||
Canned wines saw an average price per 750ml in the latest 52 weeks greater than those in any other packaging material at $11.80, according to off-premise scan data by NIQ. Boxed wines remained the most affordable at $4.07 per 750ml.